VisNow is a dataflow driven modular visual data analysis platform with extensive data processing and scientific visualization capabilities and support for large datasets. Written entirely in Java serves as an alternative to other existing generic visualization platforms. It is easily extendable to incorporate new modules and module libraries.
For the ease of use, VisNow incorporates three basic principles:
- high-level modules for ease of network creation;
- fast generation of approximate visualization (Read-And-Watch principle);
- reasonably determined default parameters.
Dataflow networks built with the help of interactive network editor can be wrapped into a stand-alone application for the end-users.
Introduction
VisNow is a generic framework for scientific visualization and visual data analysis. It follows a paradigm of a modular, dataflow driven system, where modules serve as functional nodes providing certain functionality in the visualization pipeline (e.g. data access, filtration, mapping, presentation), and connections between modules represent data.
The module-centric, dataflow driven concept of VisNow system is based on the longtime experience of usage and development of AVS systems (AVS 3-5 and AVS Express), IBM Data Explorer and several other generic visualization systems, in contrast to the data-centric paradigm of many popular systems (e.g. ParaView, VisIt). The module-centric approach can be more flexible in the case of a complex dataflow with modules requiring multiple inputs.
VisNow application allows to create networks of modules for reading data, numerically processing them, converting to geometric objects (mapping) and presenting in viewer windows. Each module provides an immediate graphical output that is automatically connected to the viewer module input, thus an immediate view of module processing results is available.
General design principles
The majority of existing systems based on the dataflow paradigm implement a fine-grained concept of relatively small building blocks requiring complicated networks to perform even simple tasks. In particular, SciRun, IBM DX, and other systems require to instantiate “technical” modules like a colormap manager, 3D scene etc. to make the first geometrical object visible. In contrast, VisNow system uses a limited number of high-level modules. For example, it is enough to use a reader, a single flow visualization module, and a viewer to obtain a reasonable visualization of a 3D vector data set. VisNow follows a Read-And-Watch principle: the user shall see some default visual representation of his/her dataset
as soon as possible. The Read-And-Watch policy is further supported by an intelligent selection of default parameters of data processing and mapping. In particular, the mapping modules that could create extremely large objects (e.g. 100,000,000 of sphere glyphs representing 512x512x400 dataset) automatically downsize the input to reasonable dimensions leaving the final control over the geometry size to the user. Both data mapping and graphic presentation of datasets are controlled independently by each module – a module’s GUI has a standard set of data mapping and presentation controls.
The network area and module controls area are always synchronized so that the controls of the module selected in the network area are displayed. In addition, picking a geometry object in the 3D window chooses automatically its creator in the network area and displays its controls. From the functional perspective, the VisNow platform provides all required layers of the visualization pipeline, starting from data access, through data processing (filtration), creation of visual data representation (mapping), up to presentation layers (rendering and display).
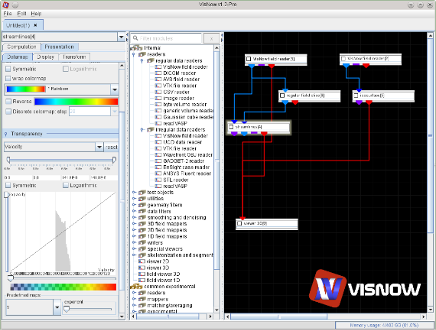
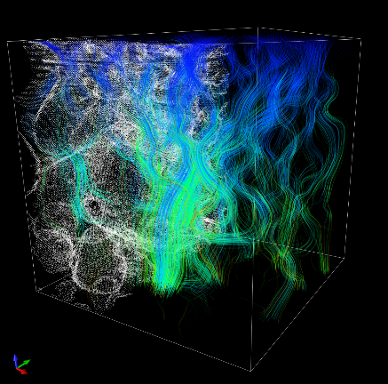
Below the example processing network of a vector field visualization and a visual result of this network are shown, for the simulation data of flow modelling through a porous medium.
Functionality
Data access modules (readers) support most common data formats (e.g. AVS field, UCD, VTK, images, DICOM, OBJ, STL, CSV, common HPC software files). In addition, VisNow offers its own metadata format called VNF. Practically any type of ASCII or binary file(s) containing data defined on a regular mesh can be described with a .vnf file and read in with the VNF reader module.
Processing capabilities of VisNow include re-meshing, data arithmetic, differential operations, transforms (e.g. Fourier, Radon), data interpolation and denoising, as well as image and volume analysis including segmentation and skeletonization. VisNow provides advanced data mapping for multivariate data including scalar and vector components with a range of colour mapping, transparency and texture mapping algorithms. The mapping modules include slicing, isosurface, volume rendering, glyph representations, streamlines, and 3D/2D graphs. Several data analysis modules are provided – e.g. parallel coordinates plot or correlation analysis. Various formats are supported to write the resulting fields or store visualization images or videos.
Implementation
VisNow is implemented in Java with Java3D as its 3D graphic engine in the Geometry Language (GL) layer. As a consequence, VisNow can be run on any operating system providing Java Runtime Environment and OpenGL. A generic data type (field) used in VisNow for data representation is based on Java Scientific Containers library (JSciC) that solves Java array size limitations by the integration of the JLargeArrays library. Consequently, VisNow supports large datasets – with more than 231 nodes. In addition, the source code of VisNow and the above libraries serve as a pure-Java toolkit of visualization blocks, similarly to VTK in C/C++ or VTK Java wrappers. The JSciC library supports dimensioned data with proper evaluation of units in data calculation and labeling. Several compute-intensive fragments (e.g. anisotropic denoising) are also implemented as accelerated libraries in CUDA.
Extensions and applications
VisNow functionality can be easily extended by programming new modules and adding module libraries (plugins), which can be created as separate Java projects (JAR files), also with different licensing. New libraries can be dynamically added and modified at runtime. Fast Java compilation opens an interesting possibility of usage of VisNow as a sort of an integrated development environment for rapid visual prototyping. The user running the newly created or modified program encapsulated into the VisNow module can use sophisticated GUI for program parameters and visual debugging. As an example, the development of non-rigid 3D registration of medical imaging data (CT, MRI) has been done entirely within the VisNow system with many algorithmic and implementation problems found and resolved under constant visual control.
Additionally, with low programming effort, VisNow platform may serve as a framework for creating applications. Any module network created in VisNow can be easily converted to a single Java program and released as a stand-alone application with hidden network creation GUI. Such application serves a dedicated functionality and suits well the needs of the end-user and is often applied in many targeted research tasks.
VisNow have been successfully applied in multiple practical problems and research projects, utilizing all layers of functionality – as a data visualization tool for communication of results, a visual data analysis tool for interactive data exploration, a dedicated visual data processing tool based on specialized modules or as a standalone dedicated application for research purposes.
Medical image processing under visual control was applied in many Computer Assisted Radiology projects, including coronary arteries reconstruction and blood flow modelling.
A large data challenge was addressed in the visualization of 4D numerical weather forecast data, where multivariate dataset on non-uniform grid of approximately 0.7 TB per simulation was processed.
Community setting
A generic visualization platform is not a novel concept. Multiple similar products were and still are available in the market, both as open-source or proprietary software. AVS/Express, OpenDX, Amira/Avizo, EnSight, SciRun, Covise, Slicer3D or Vaa3D are just some of the examples, with two leaders in the community – ParaView by Kitware and VisIt by LLNL. However, VisNow was designed to somehow fill the gaps between different platforms, solve the major drawbacks and, above all, more directly respond to user expectations by providing lower entry-level and more intuitive workflows. Contrary to ParaView and VisIt, VisNow is based on the dataflow paradigm being at the same time more intuitive to inexperienced users and allowing experienced ones the creation of very complex visualization networks. VisNow was created mainly for multicore desktops and workstations, therefore, it does not support distributed and remote systems. At the same time, Java was chosen not only for more productive development, but also to provide the same functionality on different operating systems, and to allow Java developers for simple integration with visualization libraries other than VTK. The authors found in multiple studies from both beginner and advanced user perspective, that many tasks can be solved more easily in VisNow than in other platforms and both the user interface and workflows are more intuitive.
Related publications
K.S.Nowiński, B.Borucki, “VisNow a Modular, Extensible Visual Analysis Platform”, Proc. of 22nd Int. Conf. in Central Europe on Computer Graphics, Visualization and Computer Vision WSCG2014, pp 73-76 [link]